
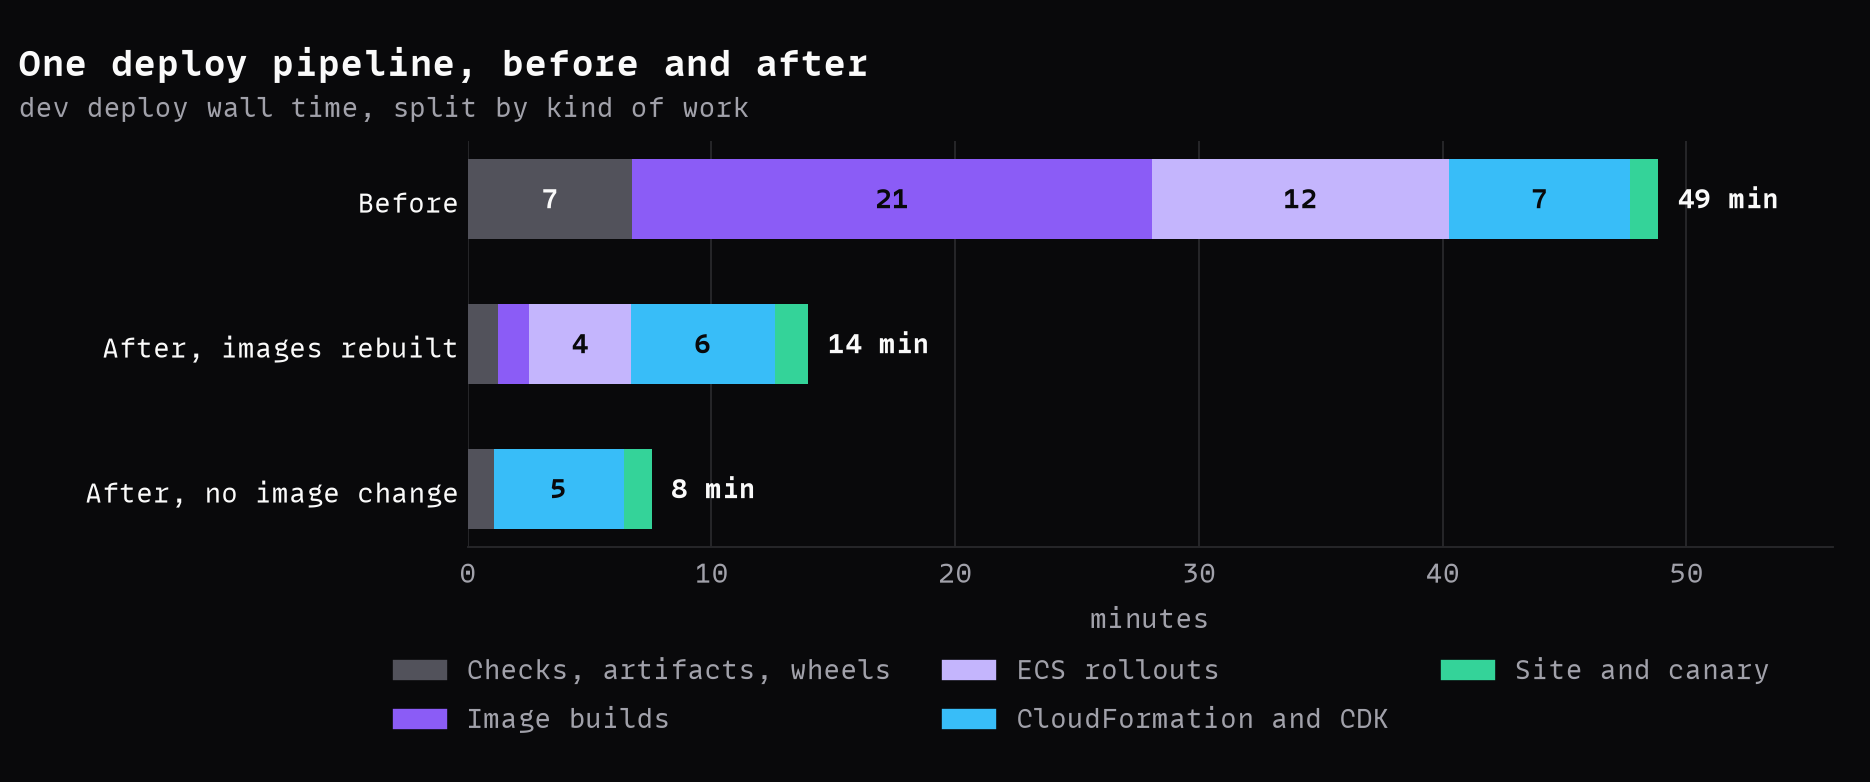
The previous post covered the side project where muda's standard came from. The first pipeline muda ran on after that was an internal platform at work: an AWS CDK app with five Docker images, three ECS services, an AWS Batch compute environment and a small website. A dev deploy took 49 minutes. Like the side project, it had been built one feature at a time with Claude writing most of the code, and none of muda's rules had been written with it in mind.
By the end, a dev deploy took about 14 minutes when the worker images rebuilt and under 8 when no image changed. The pipeline also produced three new recipes and a handful of fixes to muda itself.
Recording a baseline
muda is a Go binary and a set of agent skills. The binary only reads: the repository's GitHub Actions runs, jobs, steps and logs, its workflow files, and its branch protection and rulesets. It writes nothing except its own record, a .muda/ folder in the repository that reaches the default branch through pull requests like any other change. The skills drive a coding agent through four steps (measure, diagnose, fix, verify) and stop for a person's approval between them.
The first step, muda-measure, records a baseline. It asks which workflow plays which role and how far back to read, and writes the answers into .muda/muda.toml:
stacks = ["github-actions", "cdk", "docker", "python", "node"]

[roles]
  ".github/workflows/ci.yml" = "gate"
  ".github/workflows/deploy-dev.yml" = "deploy"
  ".github/workflows/deploy-prod.yml" = "deploy"

[window]
  since = "2026-09-07T04:07:57Z"
  until = "2026-10-07T04:07:57Z"
It then measures every run in that window, scans the workflow files for static signals (a floating runner label, a job with no concurrency group, an install with no cache), and inventories the gates: every required status check, ruleset, deploy environment and job condition that stands between a change and production. Every number in the baseline names the run, job, step or log line it came from. When a log has expired or an API call fails, the number is recorded as unavailable with the reason, never as zero, because a zero would read as "no time spent" in every comparison after it.
Split by job and step, the 49-minute deploy ran almost everything one after another:
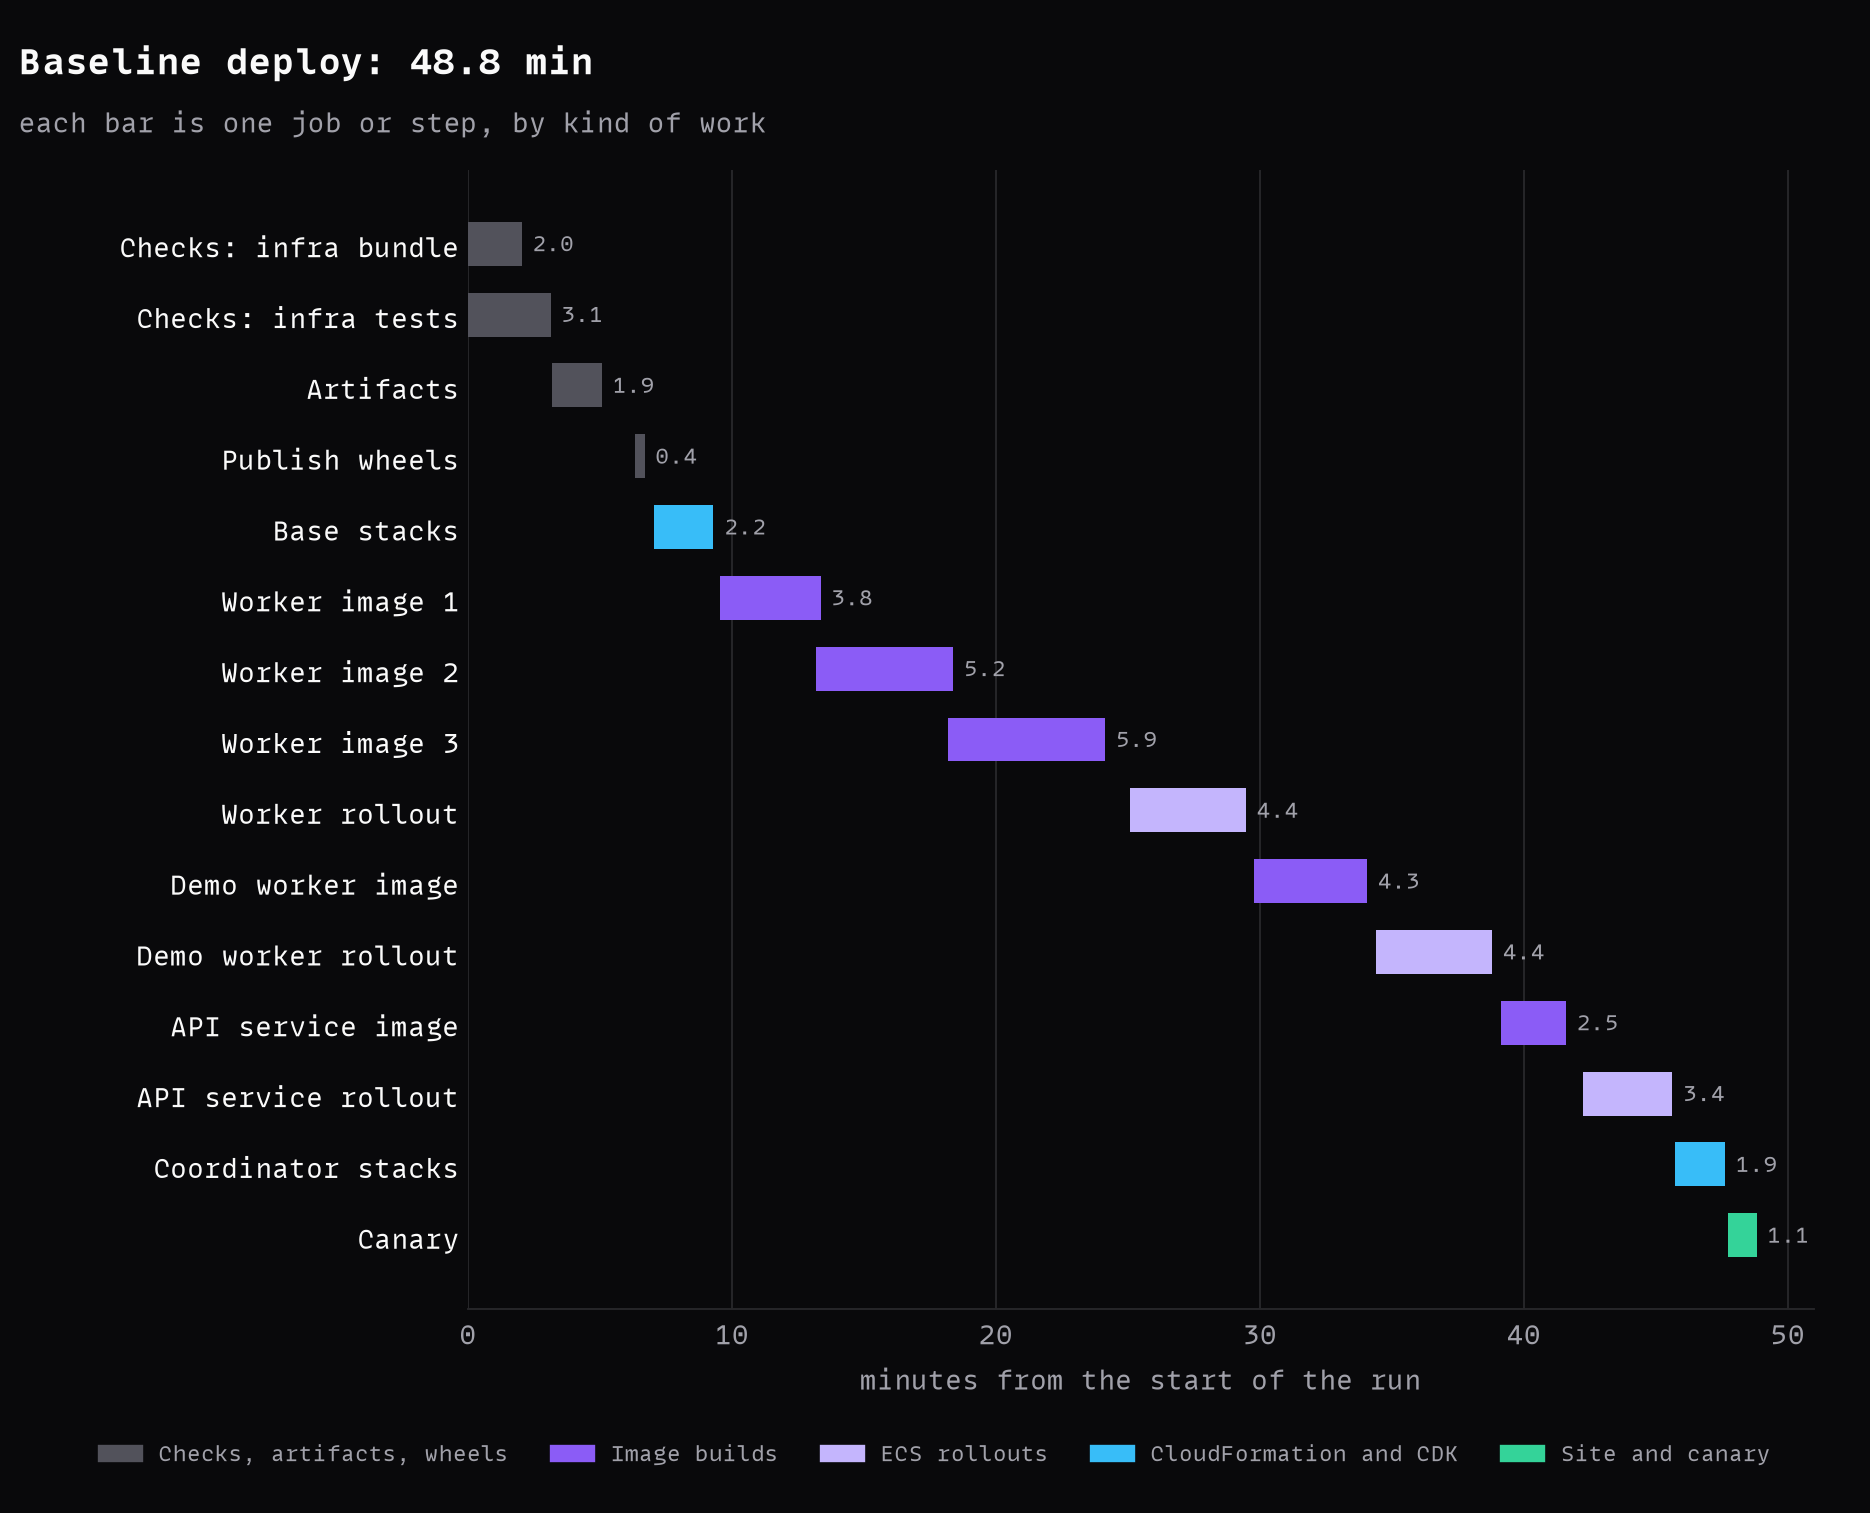
Image builds took 21 minutes of it, ECS rollouts 12, CloudFormation and CDK 7, and checks and packaging before the deploy job began another 7. The three worker images built one after another, each from the whole repository, and the API service's image only started building after the workers had finished rolling out.
Findings
muda-diagnose turns the baseline into findings. Each finding names a waste class from the standard, a recipe, the location, the evidence, an estimate of the saving and its risk. One of them, with the run ids replaced:
[[findings]]
  id = "F-002"
  waste = "W1"
  location = "workflow:.github/workflows/deploy.yml/job:deploy"
  recipe = "R4"
  basis = "measured"
  status = "fixed"

  [[findings.evidence]]
    kind = "log"
    run_id = 12345
    step = "CDK deploy (batch)"
    note = "worker assets rebuilt; diff is ci.yml only"
basis is either measured or suspected. A measured finding has evidence that shows the waste. A suspected one is likely but not shown, and it can only be fixed as an experiment with a pass bar agreed before the change. One suspected finding here was that the API service's tests generated about 1,300 RSA keys per run. Its experiment would share a pool of keys across the session, and it passed only if the test step's median over three merge-queue runs came in at two minutes or less, with the same tests passing and every wrong-key and isolation test still in place. That finding, and two others like it, were closed as exempt instead: the saving was in CI, not on the deploy's critical path.
Of the 12 findings, 7 were fixed, 4 were exempted, and 1 is still open.
One image context per package
F-002 was the largest. Every image was built with the repository root as its Docker build context, so CDK's asset hash covered every file in the repository. A commit that touched only a CI workflow changed all five hashes, rebuilt all five images and restarted three services.
R4, the recipe for it, gives each image a context that holds exactly what its Dockerfile copies. The change added an exclude list per image and a test that stages each context with CDK's own copy routine, the same one the asset hash uses, and checks it in both directions:
it("holds only the Dockerfile and what it COPYs", () => {
  const stray = [...context].filter(
    (p) => p !== file && !sources.some((s) => under(p, s)),
  );
  expect(stray).toEqual([]);
});

it("holds every tracked file the Dockerfile COPYs", () => {
  const missing = [...wanted, file]
    .filter((p) => !context.has(p));
  expect(missing).toEqual([]);
});
sources comes from parsing the Dockerfile's COPY and ADD lines, and wanted from git ls-files. The first test catches a stray file that would move the hash. The second catches an exclude that drops something the build needs, which would produce a fast build that fails at runtime.
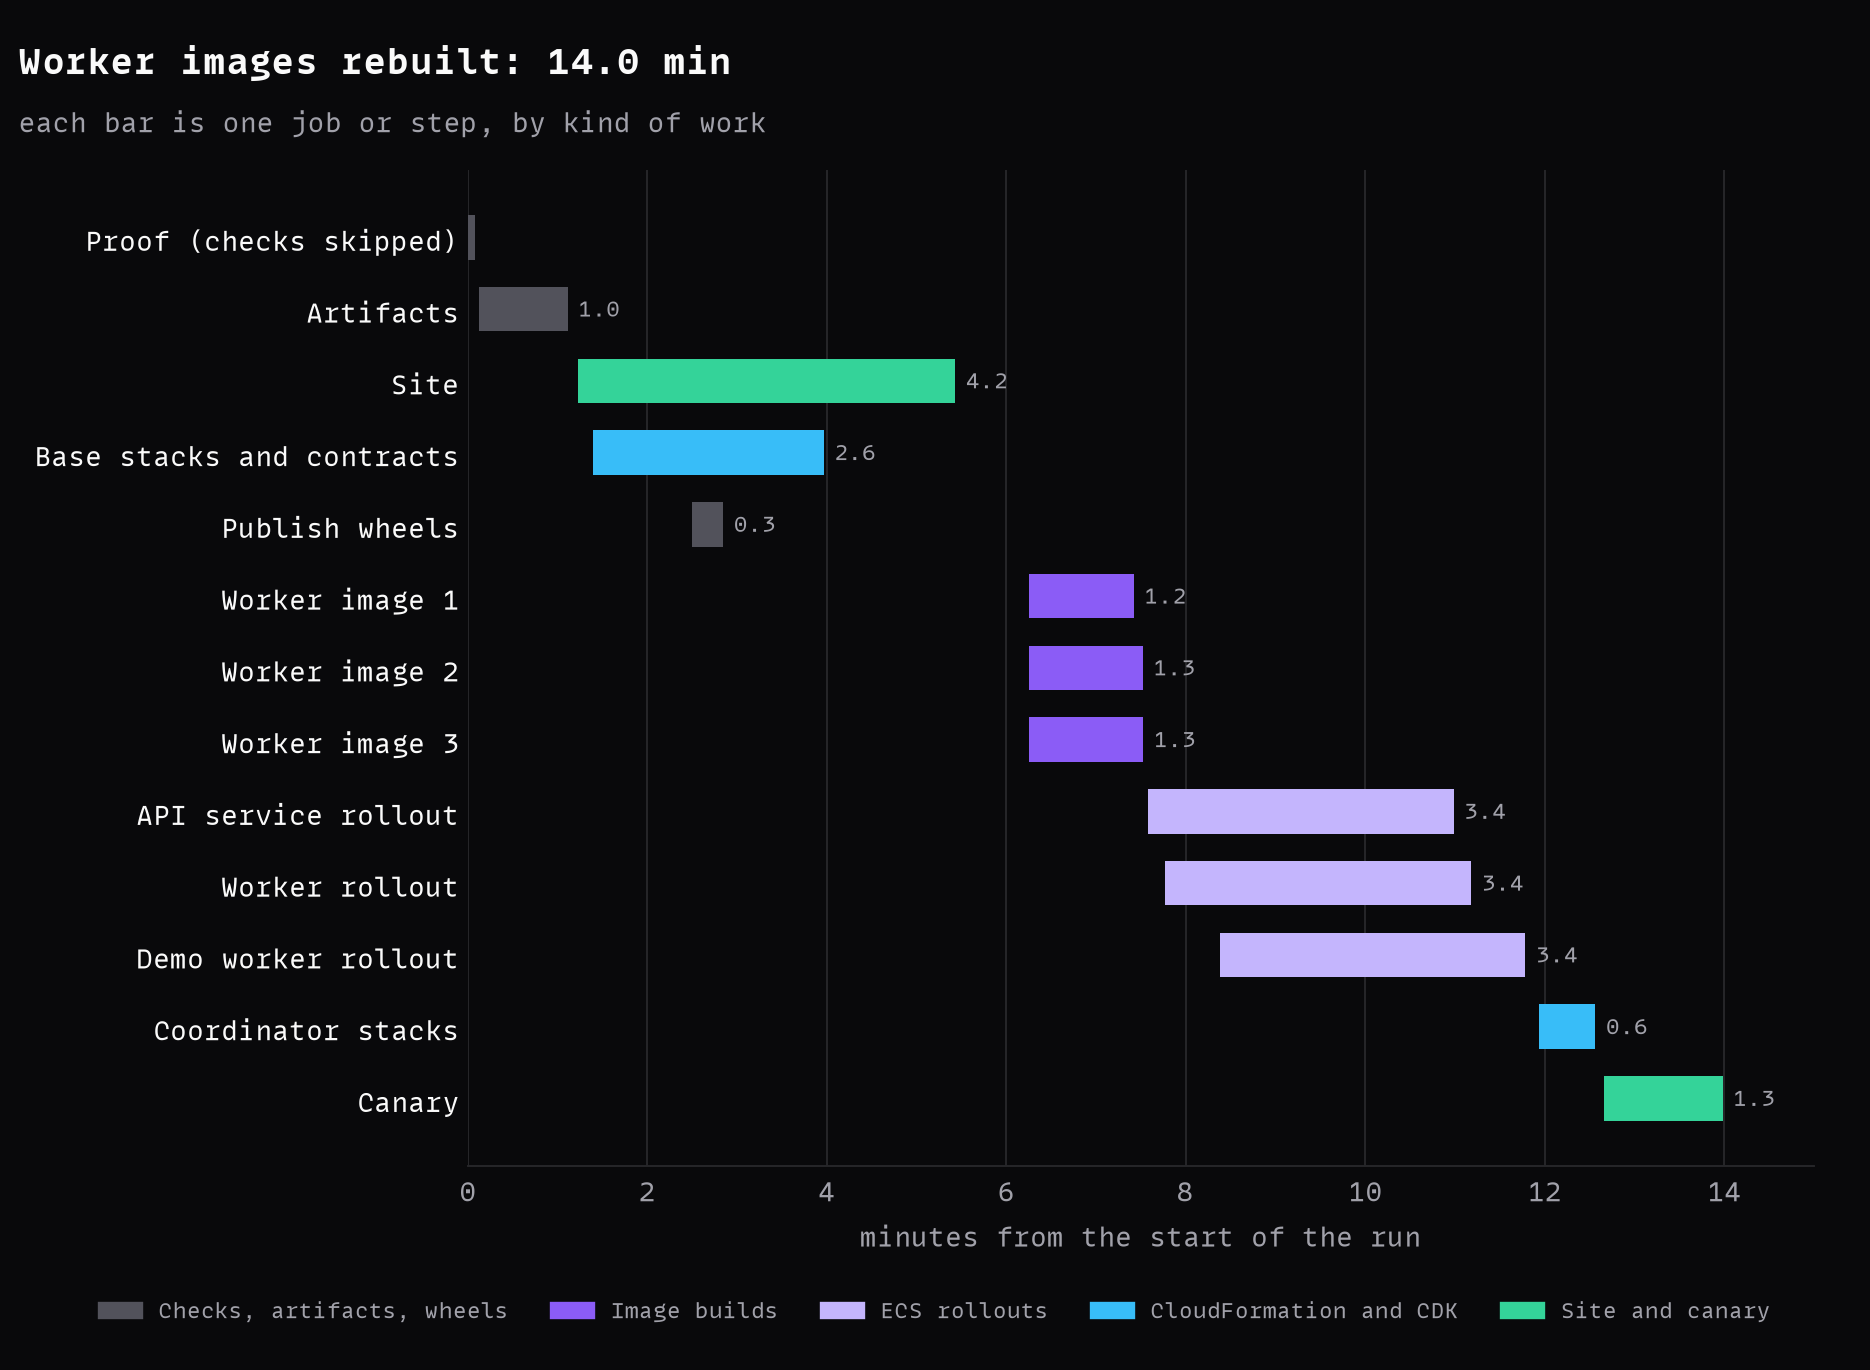
On the first deploy afterwards whose merges touched no image package, nothing built, the worker and API service steps took 33 and 12 seconds instead of 1,316 and 435, and the whole deploy took 11.5 minutes.
Verifying a fix
muda-verify checks two things on a fix: the effect, measured on real deploys of the right kind, and the gates. muda compare --gates compares the recorded gate inventory with the pipeline after the change and gives one of four verdicts:
VERIFIED: every gate is the same or stronger, and that is proven.EXEMPTED: every difference is covered by an exemption a person approved. That is acceptance, not proof.UNVERIFIED: the proof is missing, so the finding is not fixed.WEAKENED: a gate was removed or loosened, so the finding is not fixed.
An exemption names the exact file it covers, by content hash, so it can't silently cover a later edit to the same workflow:
[[exemptions]]
  id = "E-003"
  location = "gate:policy:workflow:deploy.yml@282b3434"
  reason = "Runner pin; deploy now requires checks"
  agreed-by = "Court Schuett"
  review-by = "2026-11-19"
F-002's receipt reads EXEMPTED: no gate was removed or loosened, the required-check list was identical, and the workflow files other merged changes had edited were covered by exemptions I approved. The receipt records the before and after runs, so the number in it can be checked against the logs.
The gate inventory also turned up something that wasn't a speed problem: the deploy job didn't require its checks to pass, so a failed check didn't stop a deploy, and production never waited on checks at all. That was fixed early, separately from the speed work.
Building the worker images in parallel
The three worker images built one after another inside one cdk deploy. CDK has a flag for building assets concurrently, and the batch and warm-worker stacks deploy together:
npx cdk deploy -c "env=${ENV}" --exclusively \
  "Batch-${ENV}" "WarmWorkers-${ENV}" \
  --concurrency 2 --asset-build-concurrency 3 \
  --require-approval never
On a full rebuild the three builds went from 13.5 minutes serial to between 5.4 and 9.3 minutes across six deploys, on a 4-vCPU, 16 GB runner, with no out-of-memory failures. That became the CDK section of R5. --exclusively also matters here: without it, each cdk deploy bundles the assets of every stack in the app, including stacks it isn't deploying.
Splitting a rollout into phases
Rollouts took 12 minutes of the baseline, and the first fix tried, a shorter health-check interval, made a new task turn healthy in 22 seconds instead of 85 without changing the rollout total. The time had moved to the next phase. To see where it went, I split one API service rollout of 204 seconds into its phases from the CloudFormation, ECS and load balancer events:
| Phase | Seconds |
|---|---|
| CloudFormation to task start | 13 |
| Schedule | 17 |
| Image pull | 14 |
| Container start | 12 |
| Healthy behind the load balancer | 20 |
| ECS notices | 30 |
| Deregister | 10 |
| Drain | 30 |
| Old task stops | 10 |
| Service settles | 21 |
| CloudFormation notices | 29 |
The 30-second drain looked like the obvious cut, but the API service holds long-lived streaming connections (26 to 56 minutes) and streams package downloads, and three of those connections ended exactly when the drain ran out, so it stayed at 30 seconds. On the warm worker, the old task was killed at its stop timeout instead of exiting, because the worker runs as PID 1 and Python has no default SIGTERM action there. The worker now handles the signal:
def _on_signal(signum, frame):
    _shutdown.set()
    release = _active.get("release")
    if release is not None and not release():
        return
    raise SystemExit(0)
release hands the running job's message back to SQS so another worker picks it up immediately, instead of after the message's visibility timeout. If the job has already reached its terminal handling, the release does nothing and the handler returns, so a job that is finishing still writes its result. The old task now stops in 12 seconds instead of being killed after 42, and the warm worker's rollout went from 3m24s to 2m44s.
R12 records the method: split the rollout into phases first, fix the longest one, then split it again, and judge each fix by the rollout total.
Keying the dependency layer
After the build contexts were fixed, a worker image rebuild still reinstalled and re-exported every dependency, 0.7 to 0.9 GB per image, on code-only changes. The dependency step copied the package's pyproject.toml, whose version line changes on every release, and the runtime stage copied one virtual environment holding both the dependencies and the package.
The Dockerfile now resolves the requirements in an early stage and splits them into third-party packages and the repository's own packages, writing each list to a file and printing the third-party file's hash in the build log:
grep -E '^[A-Za-z0-9]' /tmp/requirements.txt \
  | grep -viE "^($(echo $IN_REPO | tr ' ' '|'))==" \
  > /resolved/third-party.txt
sha256sum /resolved/third-party.txt
The dependency stage copies only that file, so BuildKit reuses the layer whenever the third-party list is byte-identical, whatever else changed. The repository's own packages and the code install in later, smaller layers, and installs use uv pip install instead of pip. On a deploy where only the package code and the repository's own pins changed, the three worker images built in 75 seconds instead of 8.1 minutes:
One deploy still missed the cache with no change to any third-party pin. The printed hash showed why on the next miss: the build resolves against the package index on every run, so any upstream release of a loosely pinned dependency changes the list. That is now a trap in R13, which keys the layer on an export from the lock file instead of a fresh resolve. Printing the key file's hash stayed in the recipe as its own step, because it turned an unexplained miss into a diff.
With uv the dependency layer reinstalls in 45 to 87 seconds per image on a real dependency change, against 78 to 122 seconds with pip, across three deploys. Changing every image's FROM from a floating tag to the same tag pinned by digest invalidated nothing: BuildKit keys a FROM on the resolved digest, so pinning to the digest you already pull is free.
Deploying contracts first
The API service deployed after the worker stacks had finished building and rolling out, about 13 minutes, because it read seven SSM parameters the worker stacks wrote: queue names and URLs, and job definition names. None of them had changed since each worker lane was created.
R14 splits values like these into contracts, stable names derived from config, and derived values such as ARNs with a revision or an image digest. A contracts module computes the names from config alone, and both sides use it: the worker stacks name their resources from it, and a small contracts stack writes the same values to SSM.
export function workerContracts(
  config: Config,
): WorkerContracts {
  const warm = `worker-warm-${config.env}`;
  return {
    jobQueueOndemand: `worker-ondemand-${config.env}`,
    jobQueueSpot: `worker-spot-${config.env}`,
    jobDefinition: `worker-runner-${config.env}`,
    warmQueueName: warm,
    warmQueueUrl: queueUrl(config, warm),
  };
}
The contracts stack deploys first, as its own workflow step, and every other stack then deploys at the same time. There are no CDK cross-stack dependencies; ordering is the workflow's step order, pinned by a test. On two of two deploys the API service's rollout ran alongside the warm worker's instead of about four minutes after it. The recipe's other claim, that a fresh environment comes up in one run, is labelled unmeasured, because no new environment has been brought up.
Moving the consumer to the contract keys left the seven old parameters deployed. muda had no class for that yet, so it went in as a candidate waste, lingering expand: after a rename or replacement, the superseded resource stays until a deliberate cleanup removes it. The cleanup waited until production had run the change, then deleted exactly those seven parameters in dev. It also showed that a finding exempted while waiting couldn't be closed early, which muda 0.1.12 fixed.
What changed in muda
Each new recipe was drafted only after the fix had numbers from real deploys: R5's CDK section and R12 from the build and rollout numbers, R13 from two deploys with the layer split working, R14 from two overlap deploys. When muda meets a waste it has no recipe for, or a fix or trap worth sharing, the diagnose and verify skills offer to draft a recipe submission with the project's names, ids and logs stripped out, and post it as an issue on muda's repository only after the text is approved. There is also an issue form for submitting one by hand.
Real use also found bugs. muda 0.1.1 stopped reporting a URL whose password is a ${VAR} reference as a leaked credential, 0.1.2 compares a record made before a repository rename as the same repository, and 0.1.3 accepts a cloned record with no receipts folder. In 0.1.4 the skills started sizing proof to the change's risk, with a timebox, and reading the pipeline's logs before building any offline proof. That came from agents spending 45 to 60 minutes proving one-line changes offline, when the next real deploy would show the result.
Where the time goes now
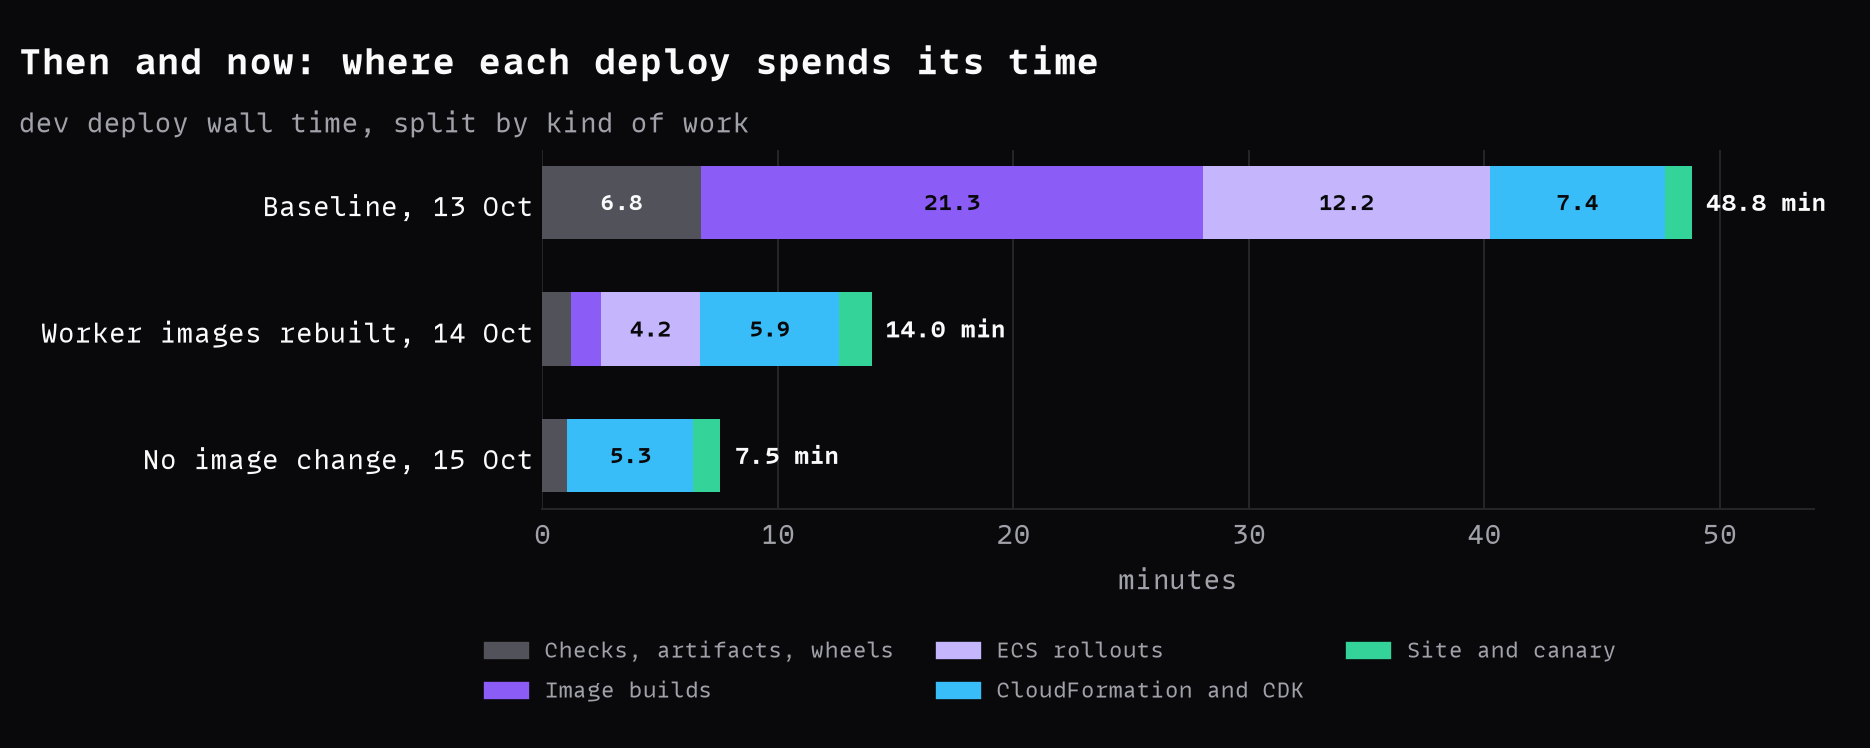
With no image change, a dev deploy is about 7.6 minutes: base stacks for 2.7, the deploy job for 2.6, and a canary for about one. With the worker images rebuilding it is 13.6 to 14 minutes, and the builds take about 75 seconds of that. CloudFormation and CDK, at 4 to 6 minutes on every deploy, is now the largest share, and it didn't shrink: most of it is synth, stack updates and polling.
muda is at muda.tools, and the recipes from this pipeline are in its repository.